

NCERT Solutions for Class 9 Maths Chapter 12 Statistics
ORCHIDS presents resourceful NCERT solutions for Class 9 Maths, Chapter 12, "Statistics." These solutions are uniquely crafted to improve understanding and boost performance in exams, helping students gain confidence in their mathematics studies.
Access Answers to NCERT Solutions for Class 9 Maths Chapter 12 Statistics
Students can access the NCERT Solutions for Class 9 Maths Chapter 12 Statistics. Curated by experts according to the CBSE syllabus for 2023–2024, these step-by-step solutions make Maths much easier to understand and learn for the students. These solutions can be used in practice by students to attain skills in solving problems, reinforce important learning objectives, and be well-prepared for tests.
Exercise 12.1
Give some examples of data that you can collect from your day to day life.
Some examples of data that we can gather from our day to day life are:
(i) Number of students in our class.
(ii) Number of fans in our school.
(iii) Electricity bills of our house for last two years.
(iv) Election results obtained from television or newspapers.
(v) Literacy rate figures obtained from Educational Survey.
(vi) Heights of 20 students of our class.
(vii) Maximum temperatures of the days of a particular week from television.
(viii) Number of members in the families of your locality from a record.
(ix) Distances from the school of the homes of ten students.
Classify the data in Q.1 above as primary or secondary data.
Primary data: When the information was collected by the investigator herself or himself with a definite objective in her or his mind, the data obtained is called Primary data. These types of data are original in character and collected for the first time for their own use.
Above mentioned (i), (ii), (iii), (iv) and (ix) are the examples of primary data.
Secondary data: When the information was gathered from a source (like newspapers, television or some records) which already had the information stored is called Secondary data. Such data has been collected by someone else in another context needs to be used with great care. These data are collected for a purpose other than that of original investigator.
Above mentioned (iv), (v), (vii) and (viii) are the examples of secondary data.
Exercise 12.2
The blood groups of 30 students of Class VIII are recoded as follows :
A, B, O, O, AB, O, A, O, B, A, O, B, A, O, O,
A, AB, O, A, A, O, O, AB, B, A, O, B, A, B, O.
Represent this data in the form of a frequency distribution table. Which is the most common, and which is the rarest, blood group among these students?
It can be observed that 9 students have their blood group as A, 6 as B, 3 as AB, and 12 as O.
Therefore, the blood group of 30 students of the class can be represented as follows.
|
Blood group |
Number of students |
|
A |
9 |
|
B |
6 |
|
AB |
3 |
|
O |
12 |
|
Total |
30 |
It can be observed clearly that the most common blood group and the rarest blood group among these students is O and AB respectively as 12 (maximum number of students) have their blood group as O, and 3 (minimum number of students) have their blood group as AB.
Distance (in km) of 40 engineers from their place of residence to their place of work were found as follows :
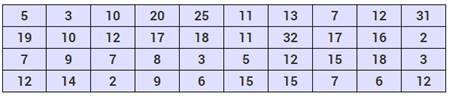
Construct a grouped frequency distribution table with class size 5 for the data given above taking the first interval as 0 – 5 (5 not included). What main features do you observe from this tabular representation?
The grouped frequency distribution table for the given data is as follows:
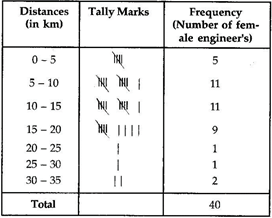
From the table we observe that out of 40 female engineers 36 (5 +11 + 11 + 9) engineers i.e. 90% of the total female engineers reside less than 20 km from their place of work.
The relative humidity (in %) of a certain city for a month of 30 days was as follows :
98.1 98.6 99.2 90.3 86.5 95.3 92.9 96.3 94.2 95.1
89.2 92.3 97.1 93.5 92.7 95.1 97.2 93.3 95.2 97.3
96.2 92.1 84.9 90.2 95.7 98.3 97.3 96.1 92.1 89
(i) Construct a grouped frequency distribution table with classes
84 – 86, 86 – 88
(ii) Which month or season do you think this data is about?
(iii) What is the range of this data?
(i) The grouped frequency distribution table for the given data is as follows:
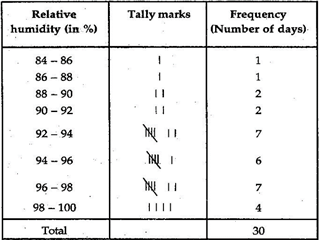
(ii) From the data we observe that relative humidity is high. So data appears to be taken in the rainy season.
(iii) From the data, we observe that
Highest relative humidity = 99.2%
Lowest relative humidity = 84.9%
Range = (99.2 – 84.9)% = 14.3%
The heights of 50 students, measured to the nearest centimeters, have been found to be as follows :
161 150 154 165 168 161 154 162 150 151
162 164 171 165 158 154 156 172 160 170
153 159 161 170 162 165 166 168 165 164
154 152 153 156 158 162 160 161 173 166
161 159 162 167 168 159 158 153 154 159
(i) Represent the data given above by a grouped frequency distribution table, taking the class intervals as 160 – 165, 165 – 170, etc.
(ii) What can you conclude bout their heights from the table?
(i) The grouped frequency distribution table for the given data is as follows:
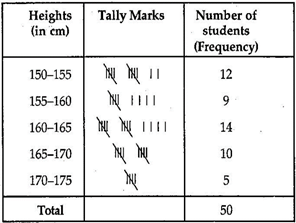
(ii) From the frequency distribution table drawn above, we conclude that more than 50% of the students are shorter than 165 cm.
A study was conducted to find out the concentration of sulphur dioxide in the air in parts per million (ppm) of a certain city. The data obtained for 30 days is as follows :
0.03 0.08 0.08 0.09 0.04 0.17
0.16 0.05 0.02 0.06 0.18 0.20
0.11 0.08 0.12 0.13 0.22 0.07
0.08 0.01 0.10 0.06 0.09 0.18
0.11 0.07 0.05 0.07 0.01 0.04
(i) Make a grouped frequency distribution table for this data with class intervals as 0.00 – 0.04, 0.04 – 0.08, and so on.
(ii) For how many days, was the concentration of sulphur dioxide more than 0.11 parts per million?
(i) The grouped frequency distribution table for the given data is as follows:
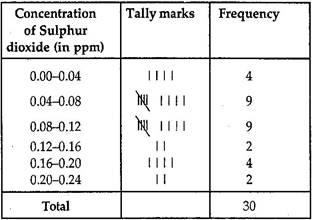
(ii) From the above frequency distribution we observe that the concentration of Sulphur dioxide was more than 0.11 ppm for 8 days.
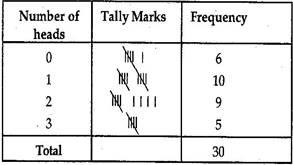
Three coins were tossed 30 times simultaneously. Each time the number of heads occurring was noted down as follows:
0 1 2 2 1 2 3 1 3 0
1 3 1 1 2 2 0 1 2 1
3 0 0 1 1 2 3 2 2 0
Prepare a frequency distribution table for the data given above.
(i) The grouped frequency distribution table for the given data is as follows:
The value of π up to50 decimal places is given below:
3.14159265358979323846264338327950288419716939937510
(i) Make a frequency distribution of the digits from 0 to 9 after the decimal point.
(ii) What are the most and the least frequently occurring digits?
(a) The value of π up to 50 decimal places is given as table:
3.14159265358979323846264338327950288419716939937510
The frequency distribution table of the digits after the decimal point in the value of πis as follows:
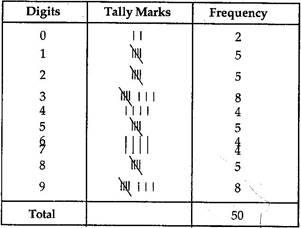
(b) Maximum frequency is 8.
Hence 3 is the most frequently occurring digit.
Least frequency is 2.
Hence 0 is the least occurring digit.
hirty children were asked about the number of hours they watched TV programmes in the previous week. The results were found as follows:
1 6 2 3 5 12 5 8 4 8
10 3 4 12 2 8 15 1 17 6
3 2 8 5 9 6 8 7 14 12
(i) Make a grouped frequency distribution table for this data, taking class width 5 and one of the class intervals as 5 – 10.
(ii) How many children watched television for 15 or more hours a week?
(i) Frequency distribution table for the given data is as follows:
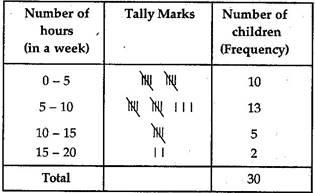
(ii) From the frequency table we observe that number of children in the class interval 15 – 20 is 2.
So 2 children view television for 15 hours or more than 15 hours a week.
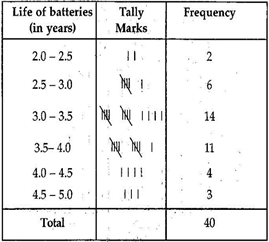
A company manufactures car batteries of a particular type. The lives (in years) of 40 such batteries were recorded as follows:
2.6 3.0 3.7 3.2 2.2 4.1 3.5 4.5
3.5 2.3 3.2 3.4 3.8 3.2 4.6 3.7
2.5 4.4 3.4 3.3 2.9 3.0 4.3 2.8
3.5 3.2 3.9 3.2 3.2 3.1 3.7 3.4
4.6 3.8 3.2 2.6 3.5 4.2 2.9 3.6
Construct a grouped frequency distribution table for this data, using class intervals of size 0.5 starting from the intervals 2 − 2.5.
Grouped frequency distribution table for the given data is as follows:
Exercise 12.3
A survey conducted by an organisation for the cause of illness and death among the women between the ages 15 − 44 (in years) worldwide, found the following figures (in %):
|
S.No. |
Causes |
Female fatality rate (%) |
|
1. 2. 3. 4. 5. 6. |
Reproductive health conditions Neuropsychiatric conditions Injuries Cardiovascular conditions Respiratory conditions Other causes |
31.8 25.4 12.4 4.3 4.1 22.0 |
(i) Represent the information given above graphically.
(ii) Which condition is the major cause of women’s ill health and death worldwide?
(iii) Try to find out, with the help of your teacher, any two factors which play a major role in the cause in (ii) above being the major cause.
(i) By representing causes on x-axis and family fatality rate on y-axis and choosing an appropriate scale (1 unit = 5% for y axis), the graph of the information given above can be constructed as follows.
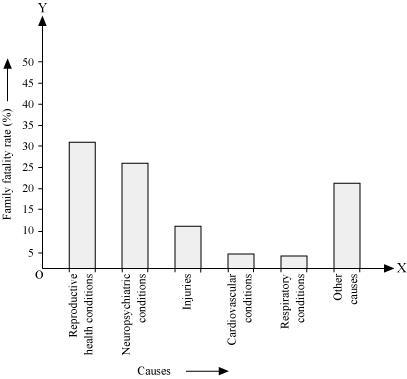
All the rectangle bars are of the same width and have equal spacing between them.
(ii) Reproductive health condition is the major cause of women’s ill health and death worldwide as 31.8% of women are affected by it.
(iii) The factors are as follows.
1. Lack of medical facilities
2. Lack of correct knowledge of treatment
The following data on the number of girls (to the nearest ten) per thousand boys in different sections of Indian society is given below.
|
Section |
Number of girls per thousand boys |
|
Scheduled Caste (SC) Scheduled Tribe (ST) Non SC/ST Backward districts Non-backward districts Rural Urban |
940 970 920 950 920 930 910 |
(i) Represent the information above by a bar graph.
(ii) In the classroom discuss what conclusions can be arrived at from the graph.
(i) By representing section (variable) on x-axis and number of girls per thousand boys on y-axis, the graph of the information given above can be constructed by choosing an appropriate scale (1 unit = 100 girls for y-axis)
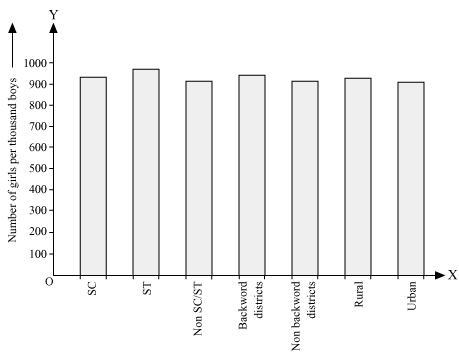
Here, all the rectangle bars are of the same length and have equal spacing in between them.
(ii) It can be observed that maximum number of girls per thousand boys (i.e., 970) is for ST and minimum number of girls per thousand boys (i.e., 910) is for urban.
Also, the number of girls per thousand boys is greater in rural areas than that in urban areas, backward districts than that in non-backward districts, SC and ST than that in non-SC/ST.
Given below are the seats won by different political parties in the polling outcome of a state assembly elections:
|
Political Party |
A |
B |
C |
D |
E |
F |
|
Seats Won |
75 |
55 |
37 |
29 |
10 |
37 |
(i) Draw a bar graph to represent the polling results.
(ii) Which political party won the maximum number of seats?
(i) By taking polling results on x-axis and seats won as y-axis and choosing an appropriate scale (1 unit = 10 seats for y-axis), the required graph of the above information can be constructed as follows.
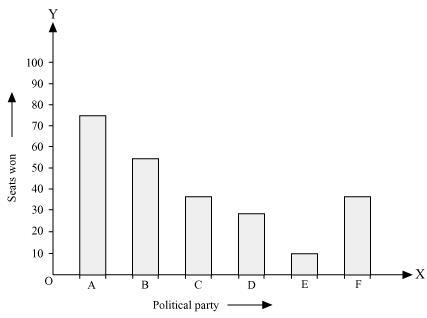
(Here, the rectangle bars are of the same length and have equal spacing in between them.
(ii) Political party ‘A’ won maximum number of seats.
The length of 40 leaves of a plant are measured correct to one millimetre, and the obtained data is represented in the following table:
|
Length (in mm) |
Number of leaves |
|
118 − 126 127 − 135 136 − 144 145 − 153 154 − 162 163 − 171 172 − 180 |
3 5 9 12 5 4 2 |
(i) Draw a histogram to represent the given data.
(ii) Is there any other suitable graphical representation for the same data?
(iii) Is it correct to conclude that the maximum number of leaves are 153 mm long? Why?
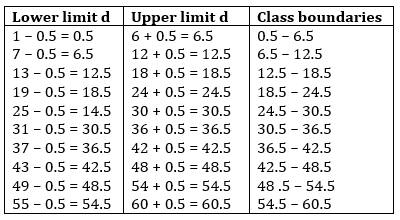
(i) It can be observed that the length of leaves is represented in a discontinuous class interval having a difference of 1 in between them. Therefore, has to be added to each upper class limit and also have to subtract 0.5 from the lower class limits so as to make the class intervals continuous.
|
Length (in mm) |
Number of leaves |
|
117.5 − 126.5 |
3 |
|
126.5 − 135.5 |
5 |
|
135.5 − 144.5 |
9 |
|
144.5 − 153.5 |
12 |
|
153.5 − 162.5 |
5 |
|
162.5 − 171.5 |
4 |
|
171.5 − 180.5 |
2 |
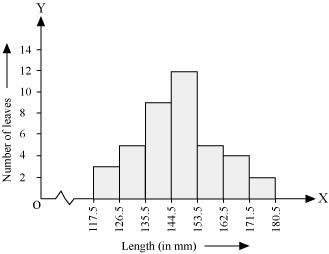
Taking the length of leaves on x-axis and the number of leaves on y-axis, the histogram of this information can be drawn as above.
Here, 1 unit on y-axis represents 2 leaves.
(ii) Other suitable graphical representation of this data is frequency polygon.
(iii) No, as maximum number of leaves (i.e., 12) has their length in between 144.5 mm and 153.5 mm. It is not necessary that all have their lengths as 153 mm.
The following table gives the life times of neon lamps:
|
Length (in hours) |
Number of lamps |
|
300 − 400 400 − 500 500 − 600 600 − 700 700 − 800 800 − 900 900 − 1000 |
14 56 60 86 74 62 48 |
(i) Represent the given information with the help of a histogram.
(ii) How many lamps have a lifetime of more than 700 hours?
(i) Representation of the given in the form of histogram is as follows:
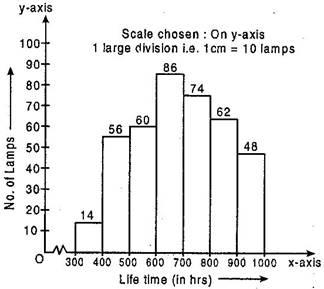
(ii) Number of lamps having lifetime of more than 700 hours = 74 + 62 +48 = 184
The following table gives the distribution of students of two sections according to the mark obtained by them:
|
Section A |
Section B |
||
|
Marks |
Frequency |
Marks |
Frequency |
|
0 − 10 10 − 20 20 − 30 30 − 40 40 − 50 |
3 9 17 12 9 |
0 − 10 10 − 20 20 − 30 30 − 40 40 − 50 |
5 19 15 10 1 |
Represent the marks of the students of both the sections on the same graph by two frequency polygons. From the two polygons compare the performance of the two sections.
We can find the class marks of the given class intervals by using the following formula.
Class mark
|
Section A |
Section B |
||||
|
Marks |
Class marks |
Frequency |
Marks |
Class marks |
Frequency |
|
0 − 10 |
5 |
3 |
0 − 10 |
5 |
5 |
|
10 − 20 |
15 |
9 |
10 − 20 |
15 |
19 |
|
20 − 30 |
25 |
17 |
20 − 30 |
25 |
15 |
|
30 − 40 |
35 |
12 |
30 − 40 |
35 |
10 |
|
40 − 50 |
45 |
9 |
40 − 50 |
45 |
1 |
Taking class marks on x-axis and frequency on y-axis and choosing an appropriate scale (1 unit = 3 for y-axis), the frequency polygon can be drawn as follows.
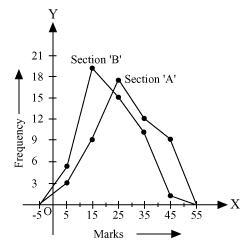
It can be observed that the performance of students of section ‘A’ is better than the students of section ‘B’ in terms of good marks.
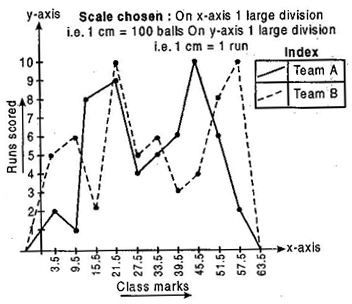
The runs scored by two teams A and B on the first 60 balls in a cricket match are given below:
|
Number of balls |
Team A |
Team B |
|
1 − 6 7 − 12 13 − 18 19 − 24 25 − 30 31 − 36 37 − 42 43 − 48 49 − 54 55 − 60 |
2 1 8 9 4 5 6 10 6 2 |
5 6 2 10 5 6 3 4 8 10 |
Represent the data of both the teams on the same graph by frequency polygons.
[Hint: First make the class intervals continuous.]
New series of given data for plotting the frequency polygon:
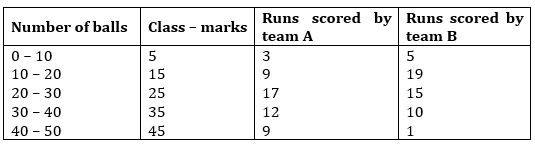
Frequency polygon of team A and team B
A random survey of the number of children of various age groups playing in park was found as follows:
|
Age (in years) |
Number of children |
|
1 − 2 2 − 3 3 − 5 5 − 7 7 − 10 10 − 15 15 − 17 |
5 3 6 12 9 10 4 |
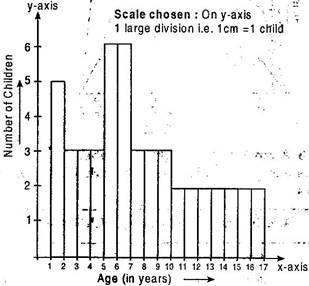
Draw a histogram to represent the data above.
Here the classes are not of equal size. Here minimum class is 1, therefore
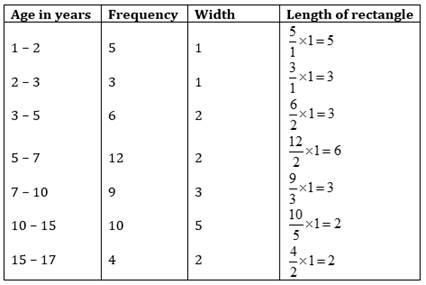
The histogram using these lengths
100 surnames were randomly picked up from a local telephone directory and a frequency distribution of the number of letters in the English alphabet in the surnames was found as follows:
|
Number of letters |
Number of surnames |
|
1 − 4 4 − 6 6 − 8 8 − 12 12 − 20 |
6 30 44 16 4 |
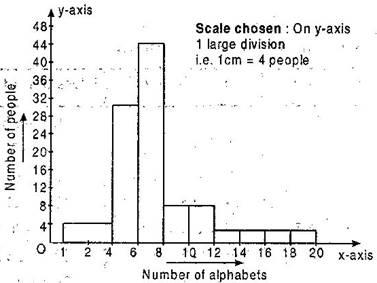
(i) Draw a histogram to depict the given information.
(ii) Write the class interval in which the maximum number of surname lie.
Here the classes are not of equal size. Here minimum class is 1, therefore
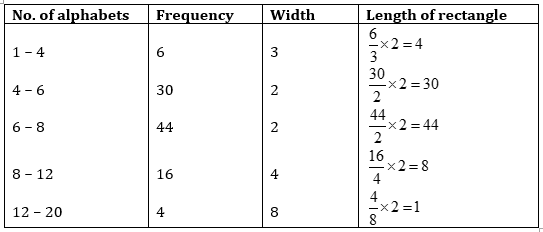
The histogram using these lengths
Exercise 12.4
In a mathematics test given to 15 students, the following marks (out of 100) are recorded:
41, 39, 48, 52, 46, 62, 54, 40, 96, 52, 98, 40, 42, 52, 60
Find the mean, median and mode of this data.
We know that, Mean =
⇒
= = 54.8
For median,
Arrange the given data in the ascending order, we get
39, 40, 40, 41, 42, 46, 48, 52, 52, 52, 54, 60, 62, 96, 98
Here n=15 which is odd in number.
Median = term =
term = 8th observation
⇒ Median = 52
⇒ Median = = 3
For mode
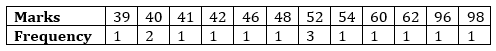
Here, Marks – 52 has the maximum frequency is 3. Therefore, mode = 52
The following number of goals were scored by a team in a series of 10 matches:
2, 3, 4, 5, 0, 1, 3, 3, 4, 3
Find the mean, median and mode of these scores.
We know that, Mean =
⇒ =
= 2.8
For median,
Arrange the given data in the ascending order, we get
0, 1, 2, 3, 3, 3, 3, 4, 4, 5
Here n = 10 which is even in number.
∴ Median =
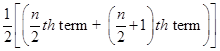
∴ Median = = 3
For mode
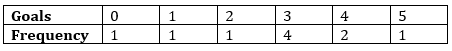
Here, Goal – 3 has the maximum frequency is 4. Therefore, mode = 3
The following observations have been arranged in the ascending order. If the median of the data is 63, find the value of X:
29, 32, 48, 52, x, x+2, 72, 78, 84, 95
Here number of observations = 10, which is an even number
Median =

= (5th term + 6th term)
⇒ 63 =
⇒ 63 =
⇒ 63 =
⇒ x +1
⇒ x = 62
Find the mode of the following data in each case:
(i) 14, 25, 14, 28, 18, 17, 18, 14, 23, 22, 14, 18
(ii) 7, 9, 12, 13, 7, 12, 15, 7, 12, 7, 25, 18, 7
(i) Making a frequency table, we have
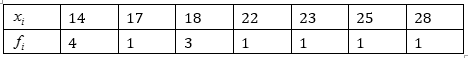
Here the observation 14 has the maximum frequency 4.
Therefore, mode = 14
(ii) Making a frequency table, we have
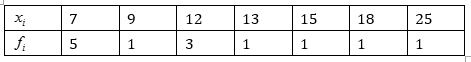
Here the observation 7 has the maximum frequency 5.
Therefore, mode = 7
Find the mean salary of 60 workers of a factory from the following table:
|
Salary (in Rs) |
Number of workers |
|
3000 |
16 |
|
4000 |
12 |
|
5000 |
10 |
|
6000 |
8 |
|
7000 |
6 |
|
8000 |
4 |
|
9000 |
3 |
|
1000 |
1 |
|
Total |
60 |
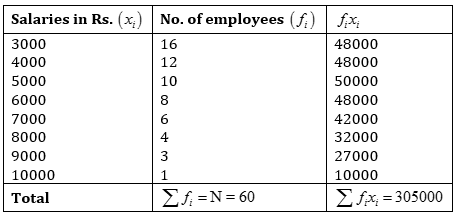
Mean =
= 5083.33
Hence the mean of salary is Rs. 5083.33
Give an example of a situation in which :
(i) the mean is an appropriate measure of central tendency.
(ii) the mean is not an appropriate measure of central tendency but the median is an appropriate measure of central tendency.
(i) Mean is the suitable measure of central tendency because every term is taken in
calculation, it is effected by every item. It can further be subjected to algebraic treatment unlike other measures i.e. median and mode. As mean is rigidly defined, it is mostly used for comparing the various issues.
For example, the marks obtained by the seven students are 10, 15, 14, 18, 26, 24, 20, 14 and 27.
Mean =
= 168/9 = 18.67
But median of 10, 15, 14, 18, 26, 24, 20, 14 and 27 is 18 and mode is 14.
From above example we conclude that mean is rigidly defined and the marks 18.67 represent the performance of 9 students, but median and mode are not so rigidly defined.
(ii) (a) Mean is much affected by the extreme value but median is not much affected by these
extremes.
For example, if there are 5 terms: 4, 7, 12, 18, 19
Mean is 12 in this case and median is 12.
If we add two values 450 and 1000 the new mean =
= = 215.7
This is a big change as compared to the size of first five terms’ mean but new median of 4, 7, 12, 18, 19, 450, 1000 is 18 which is not so much changed as compared to the size of first five terms’ median.
So we conclude that the mean misrepresents the result if extreme values are present in the data.
(b) Sometimes mean gives impossible conclusion e.g. if there are 60, 50 and 42 students in three classes then mean number of students is = 50.67, which is impossible as students cannot be in fractions. But median of 42, 50 and 60 is 50.
Admissions Open for 2025-26
Frequently Asked Questions
The NCERT solution for Class 9 Chapter 12: Statistics is important as it provides a structured approach to learning, ensuring that students develop a strong understanding of foundational concepts early in their academic journey. By mastering these basics, students can build confidence and readiness for tackling more difficult concepts in their further education.
Yes, the NCERT solution for Class 9 Chapter 12: Statistics is quite useful for students in preparing for their exams. The solutions are simple, clear, and concise allowing students to understand them better. They can solve the practice questions and exercises that allow them to get exam-ready in no time.
You can get all the NCERT solutions for Class 9 Maths Chapter 12 from the official website of the Orchids International School. These solutions are tailored by subject matter experts and are very easy to understand.
Yes, students must practice all the questions provided in the NCERT solution for Class 9 Maths Chapter 12: Statistics as it will help them gain a comprehensive understanding of the concept, identify their weak areas, and strengthen their preparation.
Students can utilize the NCERT solution for Class 9 Maths Chapter 12 effectively by practicing the solutions regularly. Solve the exercises and practice questions given in the solution.