
Circle Graph Questions for Class 5
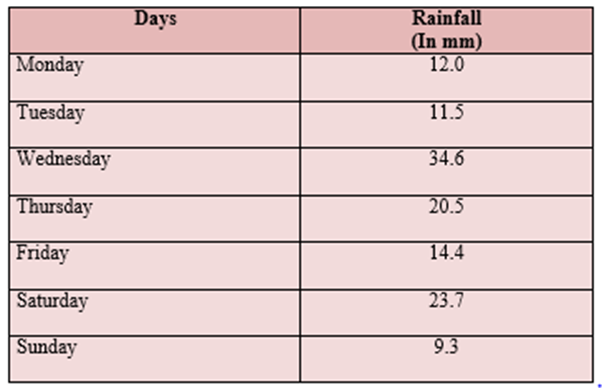
1) Suppose That in a Place, It Rains Every Day for a Week. The Amount of Rainfall for Each Day Is Shown in the Table Below. Calculate the Average Rainfall of the Week.
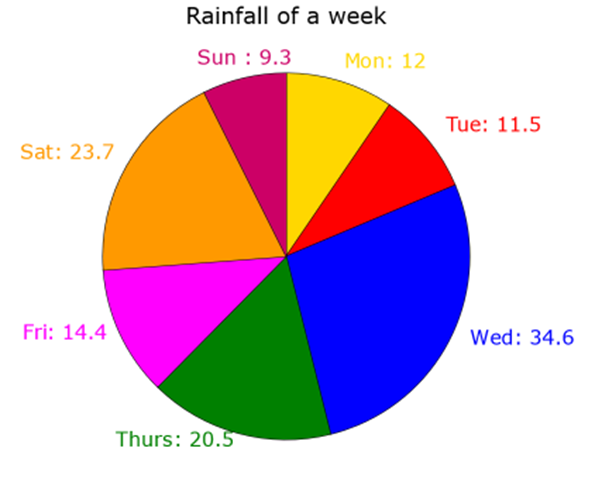
Also, Draw a Pie Chart to Represent the Given Data.
Step 1:
Add the rainfall of each day to get the total amount of rain.
12.0 + 11.5 + 34.6 + 20.5 + 14.4 + 23.7 + 9.3 = 126
Step 2:
There are 7 days a week.
Divide 126 by 7 to get the average rainfall.
126 ÷ 7 = 18
Therefore, the average rainfall of the week is 18.
Step 3:
The pie chart of the given data is shown below:
Above Circle Graph Questions for Class 5.....
Related Links
Share


CBSE Schools In Popular Cities
- CBSE Schools in Bangalore
- CBSE Schools in Mumbai
- CBSE Schools in Pune
- CBSE Schools in Hyderabad
- CBSE Schools in Chennai
- CBSE Schools in Gurgaon
- CBSE Schools in Kolkata
- CBSE Schools in Indore
- CBSE Schools in Sonipat
- CBSE Schools in Delhi
- CBSE Schools in Rohtak
- CBSE Schools in Bhopal
- CBSE Schools in Aurangabad
- CBSE Schools in Jabalpur
- CBSE Schools in Jaipur
- CBSE Schools in Jodhpur
- CBSE Schools in Nagpur
- CBSE Schools in Ahmednagar
- CBSE School In Tumkur


Orchids The International School is one of India's leading chains of CBSE and ICSE schools, with 110+ schools across the country.